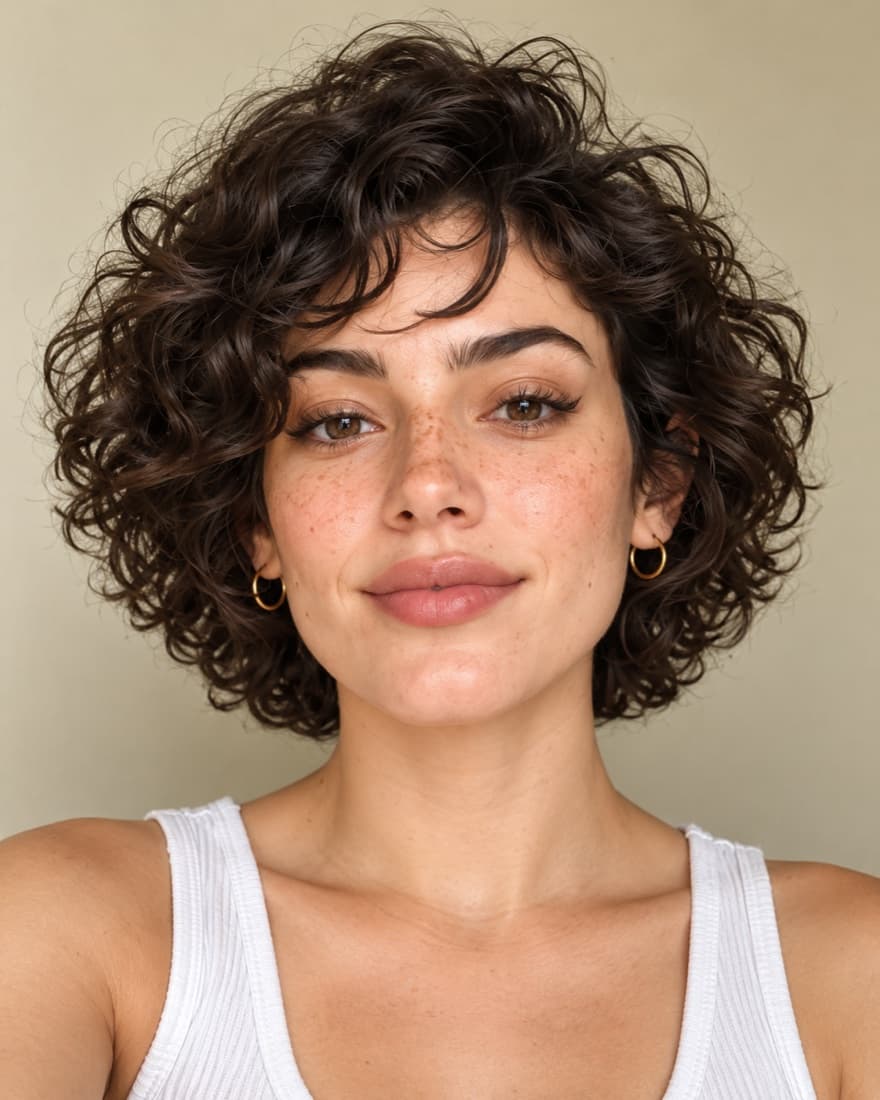
What does the PSL chart show?
Short answer: The PSL chart ranks faces from 1 to 8: 4 is average, 5 clearly above average, 6 model-level and 8 a theoretical ideal. Measured on 1,196 faces of public figures, 30.9% estimate at 4, 13.1% at 5, 1.1% at 5.5 and none at 6 or higher. FaceTwin shows your own estimate free, on your device.
The PSL chart is an informal 1–8 ladder of facial attractiveness from online looks forums. Level 4 is average, 5 is clearly above average, 6 is described as model-level, 7 is reserved for the most celebrated faces and 8 is treated as theoretical perfection; half steps such as 4.5 are used constantly. The chart is bell-shaped, so most people sit between 3.5 and 4.5. Forums only guess at the shares, so we measured them: converting the 1–10 proportions score of 1,196 frontal faces of public figures gave 9.2% at 3 or below, 24.3% at 3.5, 30.9% at 4, 21.4% at 4.5, 13.1% at 5, 1.1% at 5.5 and none at 6 or above. FaceTwin shows the same estimate for your selfie free in its PSL tab. It is a geometric estimate for curiosity and entertainment, not a measure of your worth.
- 4 = average; most faces 3.5–4.5
- 30.9% of 1,196 faces estimate at 4
- 1.1% at 5.5, none at 6+
- Estimate is free and on-device
How to use it
- Upload a selfie or take one: a front-facing, well-lit photo of yourself, no glasses, neutral expression.
- Wait a few seconds: the face model finds 68 landmarks in your browser; the photo is not uploaded.
- Read your 1–10 proportions score and the estimated PSL (1–8, half steps).
- Check which measurements raised or lowered the estimate.
PSL guides
The PSL chart with measured shares
Most PSL charts online repeat the same descriptions and invent the percentages. The table below keeps the common descriptions, written neutrally without forum slang, and adds the share of our 1,196 reference faces that the FaceTwin estimate places on each level. The reference faces are public figures — actors, musicians, athletes, politicians — so they lean above the general population, which makes the empty top rows even more telling.
| PSL | Commonly described as | Share of 1,196 faces (FaceTwin estimate) |
|---|---|---|
| 1–2 | Well below average | Included in “3 or below” |
| 3 or below | Below average | 9.2% |
| 3.5 | Slightly below average | 24.3% |
| 4 | Average — the middle of the curve | 30.9% |
| 4.5 | Slightly above average | 21.4% |
| 5 | Clearly above average | 13.1% |
| 5.5 | Well above average | 1.1% |
| 6 | Very high, described as model-level | 0% |
| 7 | Exceptional, top models and actors | 0% |
| 8 | Theoretical perfection | 0% |
Three out of four faces land between 3.5 and 4.5. That is the real lesson of the chart: it is built to squeeze almost everyone into a narrow band, so a half-step difference says very little.
PSL chart vs a 1–10 score
People asking for a PSL chart often want to translate a familiar 1–10 rating. Everyday 1–10 ratings are generous, so the same face gets a lower number on the PSL chart. FaceTwin converts its measured 1–10 proportions score with fixed anchor points and rounds to the nearest half step:
| FaceTwin 1–10 proportions score | Estimated PSL | In plain words |
|---|---|---|
| 6.0 or lower | 3 or below | Below most reference faces |
| 7.0 | about 3.5–4 | Lower-middle |
| 7.2 (reference median) | 4 | Average — the middle of the curve |
| 7.7 | 4.5 | Slightly above average |
| 8.1 | 5 | Clearly above average |
| 8.75 | about 5.5–6 | Well above average |
| 9.2 and above | 6 or more | Very rare on this scale |
The middle 80% of reference faces score between 6.4 and 8.0 on the 1–10 scale, which is exactly the stretch that maps to PSL 3 to 5.
How to read your place on the chart
- Treat half steps as noise. Lighting, lens distance and a slight head turn can move the underlying measurements enough to change a half step.
- Look at the inputs, not the label. The PSL tab shows the six measurements that moved your estimate: symmetry, golden-ratio proportions, facial thirds, canthal tilt, jaw angle and face shape.
- Compare like with like. Retake the photo in the same light and distance before deciding anything changed.
- Remember what is missing. Geometry cannot see skin, hair, style, expression or charisma, which are much of what people respond to.
What moves a face up or down the chart
The estimate comes from a weighted 1–10 proportions score. Knowing the weights shows why two faces with the same PSL can look nothing alike:
| Measurement | Weight | Median in 1,196 faces |
|---|---|---|
| Symmetry (26 landmark pairs) | 30% | 79% |
| Golden-ratio proportions | 20% | 77 |
| Facial thirds balance | 20% | 75 |
| Canthal tilt | 15% | +3.5° |
| Jaw angle | 15% | 146° |
Symmetry carries the most weight, but only 17% of reference faces reach 90% or more, so very few faces get a big lift from it. Most of the spread comes from small differences across all five inputs at once.
Why the top of the chart is empty
Forum charts describe 6, 7 and 8 as rare or impossible, and the measurements agree. Even among public figures, no face estimates at 6 or higher, and only 1.1% reach 5.5. Partly that is the scale: it was designed to be harsh. Partly it is the method: a geometric score rewards faces that are close to average proportions and very symmetric, and real faces always have small asymmetries. A top-of-chart number would need near-perfect measurements in every category at once.
This is also why chasing a higher PSL is a poor goal. If the scale is built so that almost nobody reaches the top, a 4 is not a problem to fix — it is where most people, including many celebrated faces, sit.
Check your own position privately
- Upload or take a clear, front-facing selfie in even light, with your hair off your forehead if you can.
- FaceTwin places 68 landmarks on your face in your browser; the photo is never uploaded.
- Open the PSL tab to see your estimated level, the plain-words label and the six measurements behind it.
The tool is for adults using their own photo. It is entertainment, not a medical or cosmetic assessment and not a measure of anyone’s worth.
Frequently asked questions
What is an average PSL on the chart?
4 is average. In our reference set of 1,196 faces, 30.9% estimate at 4, the largest single group, and three out of four faces land between 3.5 and 4.5.
What PSL is the top 10%?
Roughly 5 and above. In our reference set 13.1% estimate at 5 and 1.1% at 5.5, so a 5 already places a face in the top 15% or so.
Is anyone a PSL 8?
No. The chart treats 8 as theoretical perfection. Even among 1,196 public figures, no face estimates at 6 or higher.
What is a PSL diagram?
The same thing as a PSL chart: a ladder or bell curve showing levels 1 to 8 with a description for each. The table on this page is a text version with measured shares added.
How does a 1–10 rating convert to PSL?
On FaceTwin, a 7.2 proportions score (the reference median) is PSL 4, 7.7 is 4.5, 8.1 is 5 and 6.0 or lower is 3 or below. Everyday 1–10 ratings by people are more generous, so treat any conversion as rough.
Why do PSL charts online show different percentages?
Because most are guesses. Forums never measured the shares. Ours come from converting the measured score of 1,196 faces, which is still one method on one reference set.
Can my PSL change between photos?
Yes, by a half step quite often. Lens distance, lighting, head angle and expression all change the landmarks. Use the same setup each time if you compare.
Does the chart differ for men and women?
The levels are the same. In our data women’s estimates sit slightly higher: 14.3% of women estimate at 5 versus 11.9% of men. See the PSL scale for women page for the full split.
Is the PSL chart scientific?
No. It is an informal forum scale with no fixed definition. FaceTwin measures real proportions and converts them onto the chart’s vocabulary for curiosity only.
Is this for teenagers?
No. Looks ratings are for adults (18+) using their own photo. If a score is making you anxious rather than curious, step away from it.
Is my photo uploaded?
Not for local lookalikes or face analysis: the model runs in your browser, so your selfie, landmarks and descriptor stay on your device. AI portraits, including the first free one, and full reports send your photo through our server to the AI provider after a free first-portrait request or a credit purchase, and separate upload consent. Reports also send your numeric measurements. FaceTwin does not save the original photo; it is discarded from request memory after processing.
More from the same selfie
Related by topic
PSL and looks rating
The data behind the scores: FaceTwin facts · face shape statistics
Last updated 2026-10-18. FaceTwin is for entertainment and is not identity recognition, medical or cosmetic advice.